
© James Morgan / WWF-UK
Mapping Greenland
Free research tool inspires research and learning


Often when people think of Greenland, they picture icebergs floating in pristine fjords, brightly coloured homes dotting the coastline, and large expanses of ice. But as TWILA MOON and ALYSE THURBER write, Greenland also hosts some of the most important environmental data in the world, with clues to the Earth’s climate history.
Researchers from around the world have long flocked to Greenland to explore and learn from its landscapes, ecosystems and communities. Now, a diverse team from the National Snow and Ice Data Center at the University of Colorado Boulder is making these data more accessible for decision-makers, educators and the public through a project we are part of known as QGreenland.
The project came about because hundreds of researchers collect environmental data in Greenland and share the information with colleagues around the world through online platforms, databases and articles in scientific journals. But sharing data in different formats and storing information in different places can make it difficult for the public to use and may slow scientific progress. QGreenland tackles this problem.
© QGreenland
Bringing geospatial information together
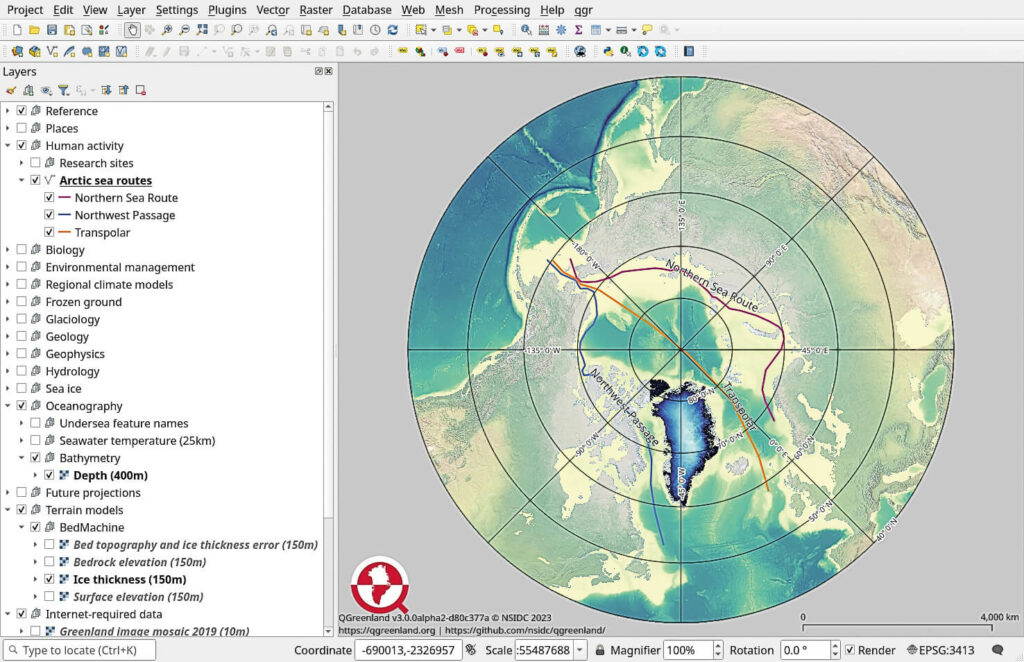
The QGreenland team wanted to bring geospatial data about Greenland together in a single, easy-to-use tool. Geospatial data are those associated with a location. For example, the digital map application that runs on your phone shows geospatial data like street names, hospital locations and restaurant phone numbers. QGreenland has similar information about roads and infrastructure in Greenland, but also includes research data about the environment.
QGreenland runs on downloadable geographic information system (GIS) software and includes everything from the locations of seabird nesting colonies and fishing zones to ice sheet changes and ice core locations. Having these data together in a single location accelerates the pace of scientific discovery, allowing researchers to better plan for future data collection and run data analyses that include the broader data landscape.
For example, on board the oceanographic research ship RV Armstrong, scientists use QGreenland to consider a variety of environmental factors at once when determining where to collect ocean sediment samples. Using QGreenland visuals, scientists can show students how factors like water depth, sea ice location and local geography help determine the best location.
Having these data together in a single location accelerates the pace of scientific discovery.
Supporting decisions and education
Brendan Reilly, a researcher with the Lamont Doherty Earth Observatory at the Columbia Climate School in the US, has told us that he and his colleagues use QGreenland as the starting point for their cruise GIS, keeping it hooked up to the ship’s navigation so it is permanently displayed in the main lab. “We’ve been using it to make real-time decisions for our geophysical surveys and sediment coring locations, and it’s been a great educational tool for discussing sites with our students,” he says.
QGreenland is also a valuable educational tool. Online video tutorials and a user guide we created help anyone—even people who have never used GIS software—to view data and create maps quickly. The high-resolution satellite images give students a sense of the vastness of the ice sheet while also revealing smaller-scale details, like how meltwater flows across the surface on its way to the ocean.
We have also developed a high school curriculum called Exploring Sea Level Change to help students and teachers visualize how much of the ice sheet might melt within the coming millennium in a rapidly warming Arctic. In this series of lessons, students use the amount of ice melt predicted in Greenland to create sea-level rise flood maps of coastal cities near them. This helps students better understand how ice in the Arctic can directly affect their lives and communities, despite how far away it may be.
The QGreenland team is now developing tools to make it easier to add other data to QGreenland or create similar data tools for other areas. Ultimately, QGreenland is helping us all see the bigger (more complex) picture for Greenland. It is showing us that the Arctic is so much more than the ice most people picture—and giving us a better understanding of the planet in the context of rapid change.


By Twila Moon
Deputy lead scientist & science communication liaison, National Snow and Ice Data Center, University of Colorado Boulder
LinkedInTWILA MOON leads the QGreenland project and is deputy lead scientist and science communication liaison at the National Snow and Ice Data Center, University of Colorado Boulder.

By Alyse Thurber
Education and outreach lead, University of Colorado Boulder
ALYSE THURBER is the education and outreach lead for QGreenland and a member of the CIRES Center for Education, Engagement, and Evaluation at University of


